These materials will help one implement a cooling solution for AD0505A/B. The thermal models shared here can reduce the number of iterations needed to achieve a satisfactory design. The numbers are obtained from COMSOL studies grounded in several reference point observations done on real devices.
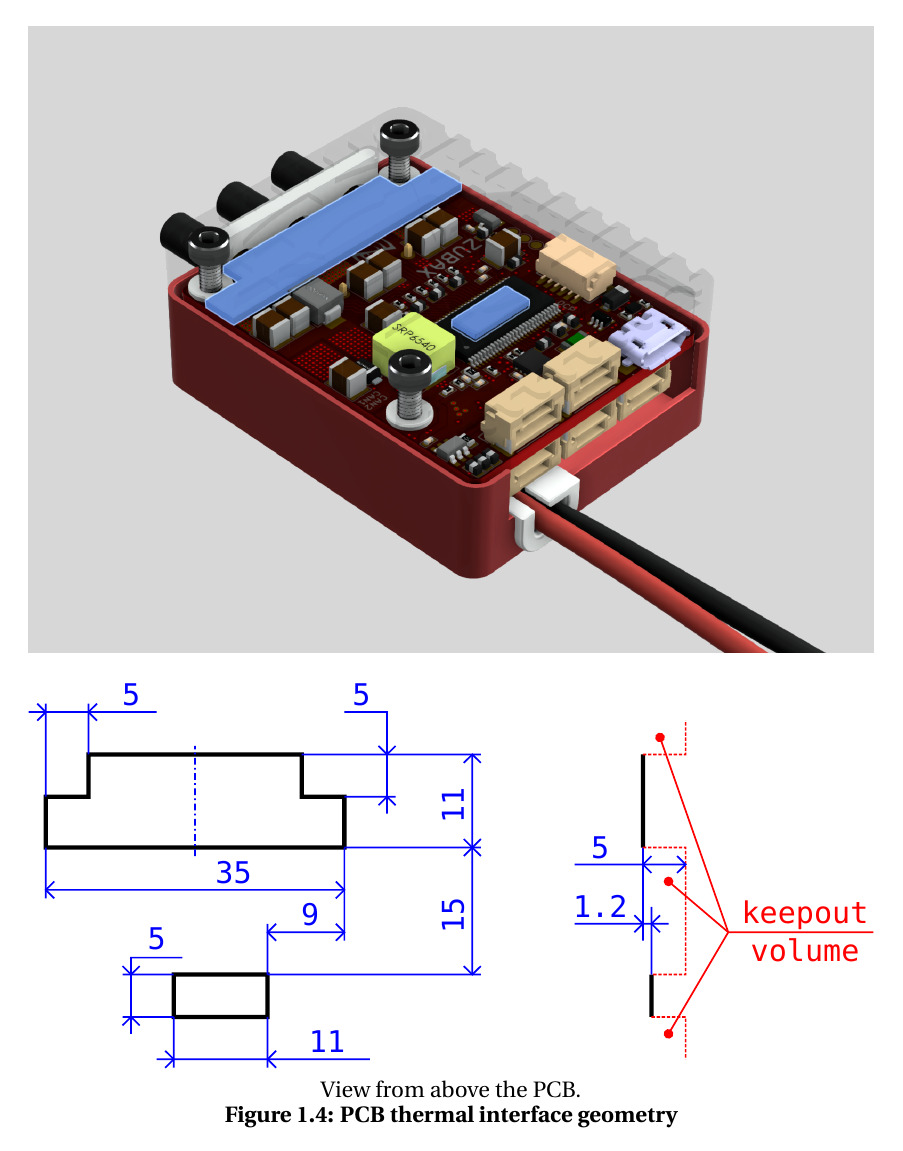
The attached script contains a fitted thermal model of AmpDrive AD0505 versions A and B, with and without the Z suffix, in various operating modes: as a bare board (models A0, B0, with or without the Z suffix), with the enclosure (models A2/B2, with or without the Z suffix), and with a custom external heatsink with the given heatsink-surface-to-ambient impedance attached to the thermal interface as specified in the datasheet:
The script to download and run: myxa_thermal_calc.py (140.2 KB)
Install the dependencies like pip install numpy sympy, download the script, and run it:
./myxa_thermal_calc.py --vdc 40 --iabc 45 --tamb 30 --cooling heatsink --rth 1.6 --wire-air 20
./myxa_thermal_calc.py --vdc 50 --iabc 35 --tamb 30 --air 20
Key thermal characteristics
Thermal impedance, junction to heatsink
The thermal impedance from the junction to the heatsink thermal interface on the PCB (shown above), defined as the hottest junction’s rise above the heatsink surface (thermal pads included) per watt of total controller loss (not per-switch), is 1.5 K/W.
Thermal impedance, junction to air, stock enclosure
The thermal impedance from the junction to air using the stock enclosure is shown below. The impedance numbers incorporate the secondary heat flow through the inside air, PCB edges, and so on. A large thermal power is sunk through the DC and motor wires as well. Conditions: maximum continuous current, maximum voltage, 25 °C ambient, variant Z, with infinitely long 1.5 mm² wires in the same airflow.
| Airflow [m/s] | R_\text{ja}, DC + phase wires [K/W] |
|---|---|
| still air | 8.4 |
| 2 | 5.6 |
| 5 | 4.8 |
| 10 | 4.4 |
| 20 | 4.05 |
| 30 | 3.9 |
Loss power
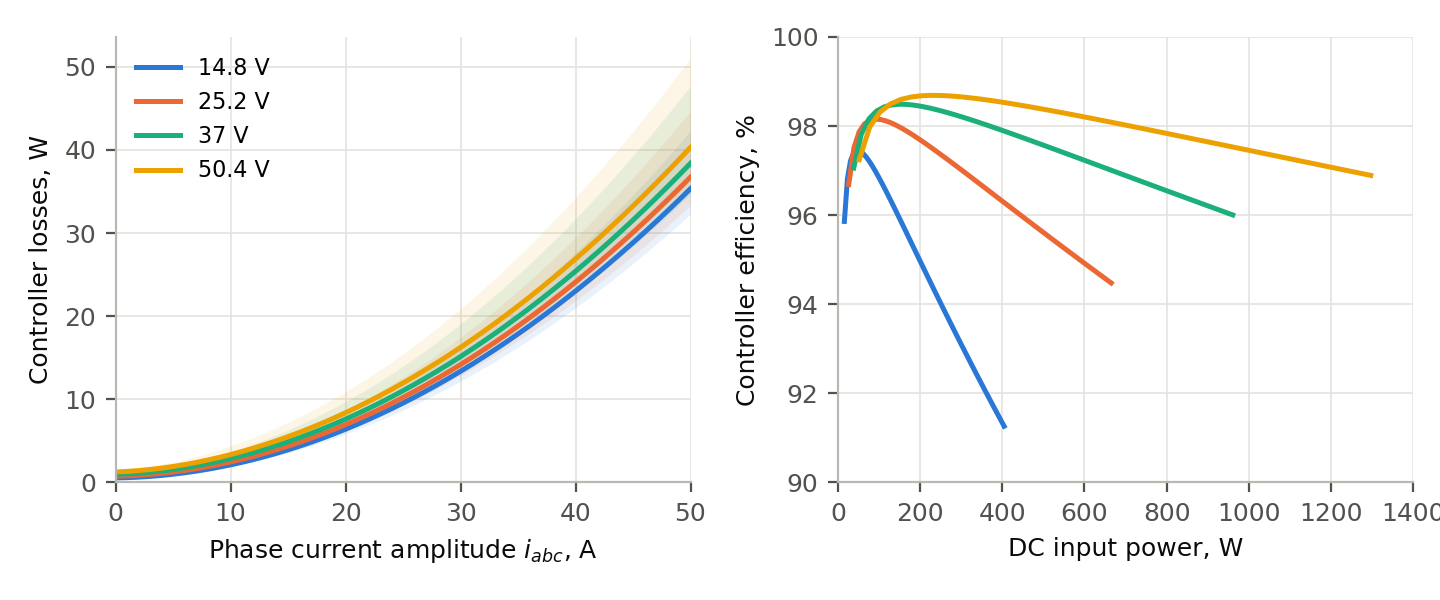
Total typical power loss as a function of DC link voltage and phase current amplitude:
| Phase current, amplitude [A] | RMS each [A] | 25.2 V [W] | 50.4 V [W] |
|---|---|---|---|
| 0 | 0.7 | 0.8 | 1.3 |
| 5 | 3.5 | 1.3 | 1.9 |
| 10 | 7.1 | 2.5 | 3.3 |
| 20 | 14.1 | 7.0 | 8.4 |
| 30 | 21.2 | 14.2 | 16.2 |
| 45 | 31.8 | 30.1 | 33.3 |
Typical power loss as a function of DC link voltage and phase current amplitude (shaded areas represent the uncertainty bounds), and the typical power conversion efficiency, are shown on the diagram below. Conditions:
- SVPWM 32 kHz, modulation index 0.7, cos φ = 0.95, variant Z, junction 100 °C, board copper 80 °C, capacitors 60 °C.
- The controller efficiency is given with the DC leads excluded.
Related
A simpler but much cruder model: Estimating the power dissipation of a motor controller